Analytics Dashboard Icons
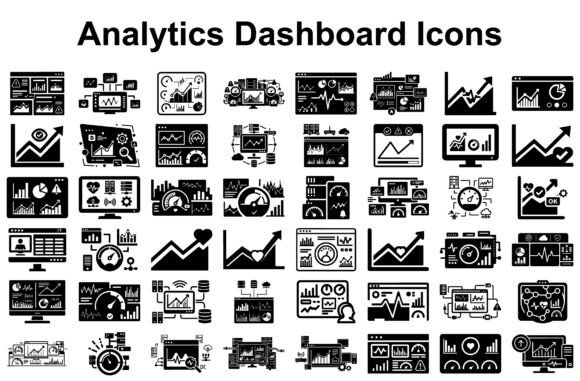
If you’re designing a data dashboard, building a business intelligence tool, or crafting a presentation for stakeholders, the right icons do more than decorate — they guide attention, clarify meaning, and reinforce trust in your interface. Analytics Dashboard Icons is a purpose-built bundle that delivers exactly that: 50 clean, modern silhouette icons representing charts, trend lines, alerts, filters, metrics panels, and UI controls — all designed with data professionals and visual communicators in mind.
Why these icons stand out (and why “just any chart icon” won’t cut it)
Many designers grab the first free analytics icon set they find — only to discover later that the icons lack consistency in stroke weight, spacing, or visual hierarchy. Others assume “SVG” means “ready for everything,” without checking whether the vectors are actually well-structured or optimized for scaling. Analytics Dashboard Icons avoids those pitfalls by using crisp, scalable vector lines across all formats — SVG, PNG, JPG, and EPS — so whether you’re embedding an icon in a responsive web dashboard or printing it on a conference handout, clarity holds up.
This isn’t just about aesthetics. Inconsistent or overly decorative icons can slow down user comprehension — especially in high-stakes environments like cybersecurity monitoring dashboards or real-time performance tracking. A cluttered alert icon, for example, might delay recognition of a critical system warning. Minimal, high-contrast silhouettes eliminate visual noise while preserving immediate legibility — even at small sizes or on low-resolution displays.
Common oversights when selecting or using analytics icons
Mistake #1: Assuming format variety equals flexibility. Just because a bundle includes PNG, JPG, and EPS doesn’t mean every file is production-ready. Some PNGs may be rasterized at low resolution; some EPS files may contain embedded bitmaps instead of true vectors. With Analytics Dashboard Icons, all 50 icons are delivered in four formats — but crucially, each SVG and EPS version is built from clean, editable paths, not traced raster images. That matters if you need to recolor icons dynamically in CSS or adjust line thickness for dark-mode interfaces.
Mistake #2: Overlooking context-specific usability. An icon that works perfectly in a marketing dashboard (e.g., a bar chart labeled “Traffic”) may confuse users in a cybersecurity context where the same shape could imply “threat volume.” The Analytics Dashboard Icons set intentionally avoids ambiguous metaphors. Its alert icon uses a sharp, centered triangle — not a bell or exclamation mark — reinforcing urgency without relying on cultural assumptions. Its “data filter” icon clearly separates input controls from output visuals, helping users distinguish between actions and results.
Mistake #3: Skipping cross-platform testing before integration. You might love how an icon looks in Figma, but forget to preview it in Chrome on a Windows laptop — where subtle anti-aliasing differences can blur thin strokes. Or you may use a JPG version in a dark-themed app, only to realize the white background doesn’t blend. Because this bundle includes transparent PNGs and vector-based SVGs, you retain full control over background handling, contrast, and color adaptation — no guesswork needed.
What to verify before downloading or buying
Before adding Analytics Dashboard Icons to your project, ask yourself three practical questions:
- Do I need editing flexibility? If you plan to tweak colors, resize aggressively, or export for laser cutting or Cricut projects, prioritize SVG or EPS files — and confirm they’re truly vector (open one in Illustrator or Inkscape to check for anchor points and paths).
- Where will these appear most often? For web dashboards or mobile apps, SVG is ideal. For printed reports or slide decks, high-DPI PNGs (300ppi) matter more than sheer file count. This bundle includes both — and all PNGs are exported at multiple sizes (64px, 128px, 256px) to suit different use cases.
- Is consistency baked in — or just assumed? Scroll through the full set before committing. Do icons share uniform stroke width? Are alignment baselines consistent? Does the “pie chart” icon visually balance with the “line graph” icon in size and weight? Analytics Dashboard Icons was designed as a unified system — not a collection of unrelated assets.
Better choices start with intention — not convenience
Let’s say you’re a freelance UX designer building a client’s SaaS analytics portal. You could download a free icon pack with 200+ “data” icons — but spend hours cleaning up mismatched styles, adjusting spacing, and converting formats. Or you could use Analytics Dashboard Icons: 50 thoughtfully curated, technically sound icons that integrate smoothly into design systems, developer handoff files, and stakeholder presentations — saving time without sacrificing precision.
Or imagine you’re an educator creating infographics about website traffic trends. You want students to focus on the data story — not decode confusing iconography. A minimal, high-contrast set ensures the visual language stays neutral and supportive, not distracting or interpretive.
Even hobbyists benefit. If you’re making custom stickers for a data science study group or prepping files for a laser-cut dashboard display, knowing your EPS files are production-grade — not placeholder art — means fewer revisions and smoother output.
A final note on value beyond pixels
Icons are infrastructure. They’re not the headline feature — but they shape how users experience speed, reliability, and professionalism. Choosing Analytics Dashboard Icons isn’t about acquiring “more assets.” It’s about reducing friction: less time troubleshooting exports, less risk of miscommunication, less rework when switching from mockup to live interface.
It’s also about respecting your audience’s time and attention — whether that’s a CTO scanning a security dashboard at 2 a.m., a small business owner reviewing weekly sales charts, or a student learning how to read KPIs for the first time. Clean, intentional iconography supports understanding before explanation ever begins.
So if your next project involves data visualization, performance reporting, or interface design — take a moment to choose icons that reflect the rigor of your work. Not just what looks good in isolation, but what works reliably, consistently, and respectfully across every screen, surface, and scenario.